Root Locus Diagram
A root locus diagram is a plot that shows how the eigenvalues of a linear (or linearized) system change as a function of a single parameter (usually the loop gain). Root locus diagrams are described briefly in Chapter 4 - Dynamic Behavior. Many control engineers find root locus plots to be a useful method for designing the closed loop dynamics of a system.
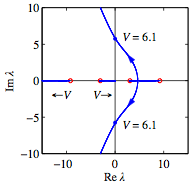
An example of a root locus diagram is shown in the figure below (from Example 4.15 in the text):
The diagram shows the location of the closed loop poles as a function of a parameter  .
.
A common use of the root locus diagram is to sketch the location of the closed loop poles as a function of the loop gain  . Given a system with a nominal loop transfer function
  , the poles of the closed loop system with gain factor
  are given by the roots of the polynomial equation

It is possible to sketch the location of the roots based on the poles and zeros of the original transfer function. For example, when  the poles of the system are given by the poles of the loop transfer function, while when
  (some of) the poles approach the zeros of the loop transfer function.
Additional information on root locus methods can be found on the following web pages (retrieved from wikipedia):
- The root locus method, from Course on Dynamics of Multidisplicinary and Controlled Systems by Christian Schmid [retrieved on 14 Jun 08].
- Root Locus Analysis of Control Systems, from RoyMech by Roy Beardmore [retrieved on 14 Jun 08]
