Phase locked loop
Contents |
that is synchronised with a given periodic system. Phase-locked loops are widely used in electronic systems, they are key components in wireless communication systems and in optical drives. The systems are used to generate a sinusoidal signal or other periodic signal that is synchronized with a given periodic signal.
Modeling
A schematic diagram of a phase-locked loop is shown below:

The system consists of a phase detector, a voltage controlled
oscillator and a filter. A multiplier combined with a low pass filter
is a simple phase detector. To analyze the system we assume that the
the input voltage  and the output
  of the
voltage controlled oscillator are sinusoidal signals
of the
voltage controlled oscillator are sinusoidal signals
|
|
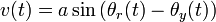
The product of the input and the output signals are
 |
= 
|

|
In the ideal case the frequencies  and
and  are both
equal to
are both
equal to  , in practice the frequencies are close. The first
term then has low frequency and the second term has high frequency.
The low pass filter and the voltage controlled oscillator will
attenuate the high frequency component and we get approximately
, in practice the frequencies are close. The first
term then has low frequency and the second term has high frequency.
The low pass filter and the voltage controlled oscillator will
attenuate the high frequency component and we get approximately

Introducing the phases  and
and  of the input and output signals defined by
|
|
we find that the phase detector consisting of a multiplier and a low pass filter can be modeled by
Assuming that the frequency of the voltage controlled oscillator is proportional to its input we find that it can be modeled by

The complete system can then be represented by the block diagram shown below

Notice that the gain of the loop is proportional to the amplitude of
the input signal. The loop filter is designed to make the sure that
the derivative of the output  tracks
the derivative of the input
tracks
the derivative of the input  . It is
required that the system can find the frequency of an input signal
(signal acquisition) and that it can track a signal with slowly
varying frequency (regulation).
. It is
required that the system can find the frequency of an input signal
(signal acquisition) and that it can track a signal with slowly
varying frequency (regulation).
Simulation
The figure below shows a simulation of a phase-locked loop where the filter is a PI controller.

The input signal is 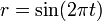 and the controller
parameters are
and the controller
parameters are  and
and  . The top curve
shows the frequency
. The top curve
shows the frequency  , the middle curve shows the
error
, the middle curve shows the
error  and the bottom curves show the input signal
 (dashed) and the output signal (full).
Notice that the frequency converges to the correct value. There is a
small high frequency oscillation of the frequency and a small
distortion of the output wave form. These defects can be eliminated by
an improved filter.
(dashed) and the output signal (full).
Notice that the frequency converges to the correct value. There is a
small high frequency oscillation of the frequency and a small
distortion of the output wave form. These defects can be eliminated by
an improved filter.
The phase-locked loop is a nice example of how block diagram structuring and approximations can help us understand and design a complex system. Also notice the appearance of a sine function, which makes design of a phase-locked loop similar to design of a stabilizer for an inverted pendulum.